
Blog Series: The ROI-Driven Marketing Playbook
If you’re new to the Grow Smart series, we’d encourage you to go back and read the first three articles: The Fundamentals of Performance Marketing ROI, The Early Days of Performance Marketing ROI, and Master Attribution. Here, we’re going to discuss a critical concept that brings additional rigor to your ad spend ROI toolkit: Incrementality.
Marketing incrementality addresses a fundamental question: what portion of sales was actually caused by your ad spend?
Unlike basic attribution models, which give credit to marketing channels without considering whether those channels truly drove a net increase in sales, incrementality seeks to isolate the incremental, causal impact of marketing on sales conversions.
Orders that originated from customers that did not see an ad are often called “organic” orders. A portion of every company’s orders come from “organic” channels, such as word of mouth or social proof. Some of the most successful brands in e-commerce have a high proportion of orders coming from organic channels.
The benefit to incrementality testing is that it can identify if ads are being wasted on customers who were already going to purchase. When you’re serving ads to users who were already going to make a purchase, you’re “preaching to the choir”. This phenomenon happens frequently when media buyers over-optimize to audiences with high purchase propensity. For example, campaigns that retarget existing customers or retarget users who visited a product landing page often exhibit low incrementality. The sweet spot for marketers is finding audiences that can be nudged to make a purchase from an ad but otherwise wouldn’t have. The more users you can find that fit this profile, the higher your ad spend ROI.
So how do you measure incrementality? Measuring incrementality involves running controlled experiments to compare the conversions of users exposed to ads with those who are not. The most common experiment is the holdout test (aka the A/B test). In a holdout test, you expose a portion of an audience to an ad (the “test” group) and simultaneously track a portion of an audience that hasn’t been exposed to the ad (the “control” group). Then you measure the conversion rates or ROAS for both groups and use this to calculate an incrementality coefficient. The incrementality coefficient is a ratio and it’s typically less than 1. An incrementality coefficient of 1 means an ad drove 100% of customers to make a purchase, so it caused 100% of the sales. In practice, incrementality coefficients are usually a lot less than 1.
Think of the incrementality coefficient as a haircut that you can apply to your observed ROAS to account for users that would have made a purchase without seeing the ad. The incremental ROAS is often called iROAS for short. The i stands for incrementality and it’s a reminder that the ROAS has been adjusted to account for the incrementality of the ad spend. Before we move on, let’s walk through an example.
Suppose you design a holdout test with 1,000 users in the test group and 1,500 users in the control group. You observe 50 purchases in the test group for a conversion rate of 5%. You observe 45 purchases in the control group for a conversion rate of 3%. The difference in conversion rates is 2 percentage points, which is 40% of the total conversions in the test group. So 0.40 is your incrementality coefficient. Putting it into an equation:

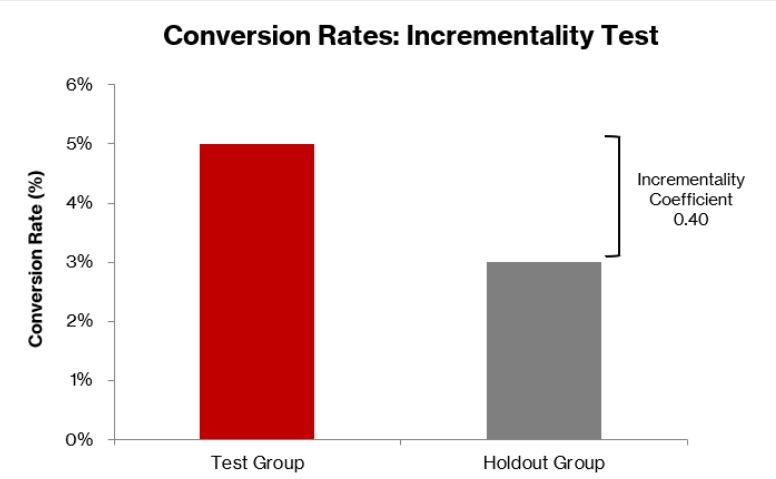
Now suppose you continue to spend on this ad campaign and you observe a ROAS of 6.0, well above breakeven. Pretty good, right? Wrong. After applying your incrementality coefficient of 0.40, you get an iROAS of 2.4, which is below breakeven. You were better off not spending money on this ad campaign.
Another type of experiment is called geo-testing. In geo-testing, different geographic regions are used as proxies for control and test groups. One region is exposed to ads, while the other isn’t. Comparing the sales in both regions over time reveals the incremental lift in the exposed region. This method is useful for larger brands running multi-location campaigns or online businesses that can isolate audiences by location.
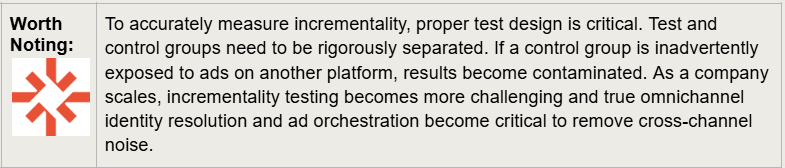
One of the most significant changes reshaping marketing measurement over the last few years is Apple’s App Tracking Transparency (ATT) framework. ATT dramatically reduces the amount of user-level data available to marketers by requiring people to opt in before being tracked across apps (most users opt out). With far fewer device-level identifiers and more aggregated, delayed, or anonymized reporting, ATT makes it much harder for marketers to determine exactly who was exposed to an ad and who wasn’t. This loss of visibility directly impacts incrementality experiments: test and control groups are more difficult to define cleanly, exposure gaps become more common, and brands often need larger sample sizes or longer test durations to reach statistical significance.
As a result of ATT, incrementality measurement has shifted toward approaches that don’t rely on tracking individual user journeys. These include geo-testing, holdout experiments grounded in first-party data, and more advanced bayesian modeling. While these methods still provide reliable insight into incrementality, they require more thoughtful experimental design and stronger data foundations to overcome the reduced signal environment created by ATT.
So what software applications are available today to measure incrementality effectively?
Both Meta and Google offer sophisticated tools to measure incrementality and are a great way to start running holdout tests. Google’s “Conversion Lift” tool explicitly supports measuring the causal impact of ads by comparing exposed and unexposed groups. Meta offers “Conversion Lift Study” and other experiment formats (e.g., geo/holdout tests) within its platform. One limitation of Meta and Google is that their built-in tools only measure the impact within their respective ecosystems, leaving a potential exposure gap if there are other ad channels where customers are seeing your ads. If you want a broader view of incrementality across multiple channels to understand how different channels complement or cannibalize each other, you can use other third-party incrementality software, such as Measured or INCRMNTAL. Measured provides a cross-channel solution that covers digital channels including Meta, Google, TikTok and also offline media. INCRMNTAL is another tool with similar functionality that is used by a lot of mobile-first companies.
Now let’s talk through some best practices and practical challenges to keep in mind when designing your incrementality experiments.
- It’s important to design your experiment so that the results are statistically significant. Statistical significance has a specific meaning here. It indicates that the difference between the conversion rates for your test and control groups isn’t due to random chance. Achieving statistical significance requires a sufficiently large sample size, which you can calculate using a power analysis (typically based on your baseline conversion rate, the minimum detectable lift you care about, and your desired confidence level). You also need test and control groups that accurately represent your broader audience. Random assignment is the best way to accomplish this. At a minimum, ensure the groups are as similar as possible to avoid distortion, skew, or systematic differences. In practice, this can be difficult for brands with low order volume or many simultaneous campaigns.
- Keep in mind that holdout tests capture performance at a single moment in time. You must run them repeatedly and across different campaigns, seasons, platforms, and promotional periods to understand how incrementality varies under different conditions.
- Some channels, such as podcasts, affiliate networks, and PR, don’t allow for clean holdout experiments because you cannot selectively suppress ads or reliably control who is “exposed” to an ad. In these cases, marketers rely on Bayesian inference to estimate incrementality. Bayesian models combine observed data (e.g., traffic spikes, attribution tags, historical performance) with prior beliefs about a channel’s effectiveness to produce a probabilistic estimate of incremental lift. This approach allows you to approximate incrementality even when true A/B testing is operationally impossible.
- If your product has a long purchase cycle (many B2B SaaS products fit this description), you may need weeks or months before customers convert, making holdout tests expensive and slow. For these products, incrementality must often be inferred through modeling or through shorter-cycle proxy metrics such as leads, qualified traffic, or early-stage funnel actions.
- It’s important to note that incrementality testing has an opportunity cost. When you create a holdout group, you’re intentionally not exposing users to an ad, which may impact your sales. If you are a smaller company and your sample sizes must represent a large portion of your customer base, running incrementality tests may be too costly.
- The software tools I mentioned earlier will only get you so far. To run effective incrementality tests, you need an experienced marketer to help with experiment design and marketing analytics to avoid over-investing in tests and sacrificing too much sales to holdout groups, while still generating enough insight to guide media mix and budget decisions.
About the Authors:
Karsten Loose is co-founder and Managing Partner at Karlon Group, a fractional finance and accounting firm that helps companies build, scale, and optimize their finance and accounting functions. Karlon Group works with companies across SaaS, e-commerce, manufacturing and technology, offering a full suite of finance and accounting support tailored to each client’s changing needs.
Ian Yung is founder of NAA Solutions, a fractional GTM consultancy that helps consumer brands overcome growth challenges. NAA Solutions diagnoses growth barriers and implements testing strategies to reduce acquisition costs and/or increase scale. With a focus on profitability, all scaling efforts are designed to not compromise margins, while driving sustainable growth for each client.