
Blog Series: The ROI-Driven Marketing Playbook
This is the second article in a five-part series about ad spend ROI, authored by Karlon Group. In this article I’ll explain how to look at ad spend ROI in the early days, when you have a modest marketing budget, a limited marketing tech stack, and a lean team. Before diving in, let’s recap a few key concepts from our first article, The Fundamentals of Performance Marketing ROI
Attribution: The process of assigning each customer’s order to a particular marketing channel or channels so you can connect the cost of your ad campaigns to the profit generated from each purchase.
Contribution Profit: The profit generated from each purchase factoring in all the variable costs that a company incurs to service the customer. Depending on whether you’re a consumer tech or an e-commerce business, these costs may include:
- Consumer Tech: Compute costs, customer onboarding costs, promotional discounts, refunds, merchant/app fees, customer support costs
- E-Commerce: Physical product costs, product shipping costs, promotional discounts, refunds/returns, return logistics costs, merchant/app fees, customer support costs
Purchase Cycle: How long it takes for a customer to make a purchase decision. When customers see your ad, they don’t necessarily make a purchase on the spot. In general, the more expensive a product is and the more features it has, the longer the purchase cycle. It’s important to start looking at your own business early to figure out how long it takes your customers to buy your product.
Lifetime Value (LTV): The contribution profit of a customer over the lifetime of the customer. For subscription businesses, a customer will usually make more than one purchase before they cancel or opt out. To calculate LTV, you should look at the average lifetime of a customer, factoring in the average rate at which customers cancel or “churn”.
Now let’s talk about the early days as a company and how you should measure ad spend ROI. When you’re a young startup, your tools and resources are limited. You’re probably using Shopify or Stripe as your source of truth for revenue, orders or subscriptions. You’re probably pulling marketing spend data directly from the portals for Meta, Google and other channels. You haven’t invested in marketing attribution or identity resolution software yet. Your marketing team consists of one or two people and they may rely on one or two agencies to handle media buying. You don’t have a finance team or a data analytics team to help you. With this setup, how should you look at ad spend ROI?
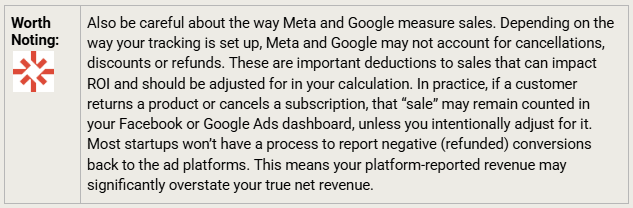
Let’s start with attribution. The good news is that you’re not completely in the dark here. Meta and Google both have their own proprietary models that can be used to attribute sales back to channel-level ad spend. The challenge, however, is that they only provide attribution metrics for their own channels and – no surprise – they tend to be generous in how they attribute sales back to their own channel. For instance, Facebook’s ad platform credits itself with a conversion even if a user merely views an ad, and purchases later (Facebook counts 1-day view-through conversions). In contrast, tools like Google Analytics and Shopify only count a click-through as a conversion. As a result, it’s common for Facebook Ads Manager to report more conversions than Google Analytics for the same campaign (source). Every platform uses different tracking windows and methods, so be mindful of this when pulling data directly from the platforms.
You also have access to Google Analytics, which provides attribution on a last-click basis for free1. Last click attribution is the simplest form of attribution, but that’s okay. In many ways, it’s the most concrete method of calculating attribution.
As a startup with limited data and tools, I’d recommend you look at the ad platforms’ proprietary attributed sales numbers and the last click sales numbers, where available. I’d also strongly recommend you look at total sales vs total ad spend as a whole. I’ll come back to why this provides a critical “macro” point of view on ad spend ROI.
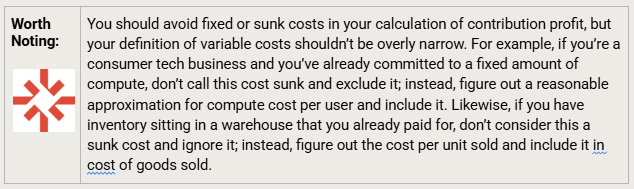
Once you have your attributed sales by ad platform and your total sales, the next step is to calculate the contribution profit generated from those sales. Remember, contribution profit isolates only the variable costs that a company incurs to service the customer while ignoring the fixed costs. One way to think about this is to ask: if a customer makes a purchase, what costs will my company incur as a result of that purchase? Earlier in this article, I listed the main variable costs you can expect in consumer tech and e-commerce.
A simple example: Suppose your average order value is $59 and your product cost (COGS) is $21. Assume you spend another $8 on shipping, payment processing, and other transaction-related fees. In this case, your total variable cost per order is approximately $29, leaving around $30 in contribution profit from a $59 sale. If your advertising cost to acquire that order was $25, your net profit on the first purchase would be $5.
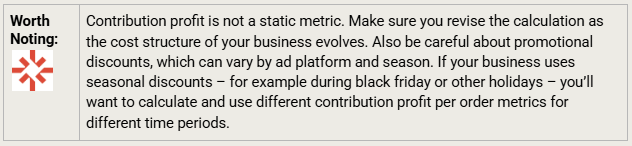
One additional consideration is how to factor refunds and returns into your analysis. Whether an order is refunded/returned is a binary outcome. Either the order is returned or it is not. The same goes for a refund of a software subscription. This is different from the other variable costs we’ve discussed. The other variable costs are incurred on every order. But we have to account for the cost of the occasional return somehow. So we subtract a portion of sales to reflect the occasional refund/return using the refund/return rate quoted as a percentage.
For e-commerce companies, a refund/return not only impacts sales, it also results in additional reverse logistics costs to ship the physical product back to the company’s warehouse. It’s worth putting numbers to this: the average return rate in e-commerce was 17% in 2024 (source), meaning roughly one in six orders ends up getting refunded. The company not only loses the sale but also typically bears all or most of the cost to ship the product back to the warehouse, inspect it and restock it (or scrap it). These costs can be huge, ranging from 20% to 65% of the item’s original value. We should account for all of these costs in contribution profit. To do so, we apply the return rate (quoted as a percentage) to the reverse logistics cost per returned order to reflect the proportion of orders that are returned. At Karlon Group, we typically calculate a refund-adjusted contribution profit to provide clients with a more accurate view of profitability. If you ignore returns in your ROI calculation, you could be overstating your real revenue and profit significantly
The end result is an equation for contribution profit that looks like this:
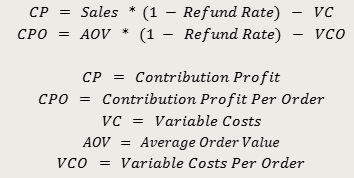
Now let’s talk more about contribution profit for subscription businesses. For subscription businesses, a customer will typically make more than one purchase over their lifetime. Some subscription products come with a commitment period – for example a one-year subscription – and customers can’t cancel the subscription until the end of the period. For these types of businesses, it makes good sense to calculate the lifetime value (LTV) of your customer, factoring in the rate at which customers cancel or “churn” on average. If you look up the calculation for LTV, you may come across a general equation that looks like this:
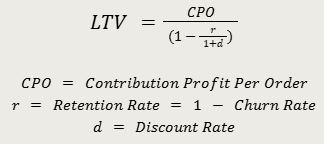
There’s nothing inherently wrong with the general equation for LTV, but I prefer to avoid it because it requires a point of view on the discount rate. That said, once you determine a reasonable discount rate for your business, the equation is simple enough to calculate.
If you don’t have a point of view on the discount rate for your business, a simple work around is to ignore it and look at a shorter time horizon for customer orders. Many practitioners use 3 years. If you look at a 3-year time horizon and ignore the discount rate, the equation looks like this:
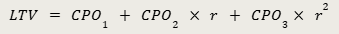
For businesses with churn rates in the 30-70% range, this approximation gets you pretty close to the LTV .
For non-subscription businesses, where customers must opt in to each purchase, you can still calculate LTV, but order frequency will vary a lot depending on the type of product or service you’re selling.
If your average customer orders two or fewer times per year, I recommend you ignore LTV and instead focus on first order contribution. If your average customer orders more than two times per year, then it makes sense to look at LTV. Why this distinction? The reality is most e-commerce brands see relatively low repeat purchase rates – often only about 15-30% of customers come back to make a second purchase (with variations by industry, of course). If you sell a product that’s bought infrequently by most customers, it means the majority of new customers won’t make a second purchase anytime soon (source). In this case, you need to make sure the first purchase is profitable. Relying on an LTV that doesn’t materialize can lead to poor investment decisions.
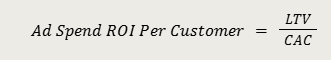
Once you’ve calculated contribution profit per order or LTV, the next step is to compare it to the ad spend to acquire a new customer, otherwise known as customer acquisition cost or CAC2.
Typically, practitioners will compare the two variables in the form of a ratio. Over the years, this ratio has been given many names and acronyms. Here I refer to it as Ad Spend ROI Per Customer.
If you’re looking at the first order only, the equation becomes
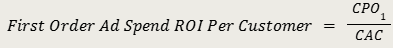
Let’s think about what this ratio means and what it can tell you about your ad spend ROI. If the ratio is 1:1, that means your contribution profit from the customer is equal to the ad spend to acquire that customer. In other words, you’re not making any money on this customer. You’re breaking even at least, but you’re not making any money. If you’re only looking at the first order, that might be okay. It depends. But if you’re looking at LTV vs CAC, an Ad Spend ROI of 1 indicates you probably have a problem with your customer acquisition strategy.
Here’s a generic hierarchy of Ad Spend ROI Per Customer:
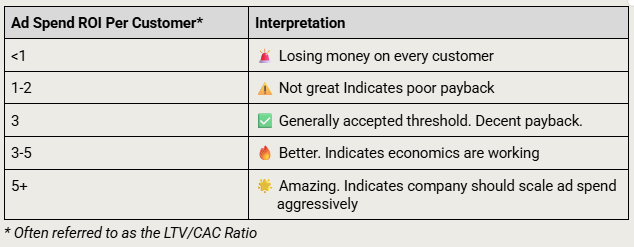
This hierarchy aligns with industry benchmarks. A common rule of thumb is that Ad Spend ROI Per Customer of 3 is considered healthy. Ad Spend ROI Per Customer of 4 or above signals you could invest more in growth – you’re likely under-spending on marketing relative to how valuable your customers are. Ad Spend ROI Per Customer below 1 means you’re losing money on each customer (e.g. spending more to acquire them than they contribute in profit of their lifetime). Hawke Media’s CEO, Erik Huberman, stresses this framework often with new clients. A 1:1 ratio is “burning cash,” ~3:1 is ideal profitability, and 5:1 might mean you’re leaving market share on the table by not scaling ads faster.
As I mentioned in the first article, The Fundamentals of Performance Marketing ROI, whether you’re a ubscription business or not, you’ll want to understand First Order Ad Spend ROI. For an e-commerce business, if your average customer purchases two or fewer times per year, I recommend you make sure your First Order Ad Spend ROI is above 1. If you’re a subscription business, you may be willing to accept a First Order Ad Spend ROI below 1 because you have more repeat orders with greater certainty.
Either way, there is an important tradeoff at play. The longer the payback, the more money you’ll spend to grow. This has implications for everything from EBITDA and cash flow to fundraising and valuation. Brands that rely heavily on future repeat purchases to reach contribution profit breakeven face more uncertainty. They burn more cash as they grow, which increases the capital required to scale. Meanwhile, investors are well aware of the risks and the dilemma, so they’re less willing to invest. In this way, ad spend ROI is one of the more important metrics to get right. You should be constantly, relentlessly seeking ways to optimize and improve it.
Low ad spend ROI can be driven by a number of factors. Your CAC could be high, which means you’re spending too much to acquire customers. This could be driven by competition, campaign flaws, or ineffective performance marketing tactics. Marketing channel mix and spend levels are also important factors. Weak ad spend ROI can also reflect underlying unit economics. You could have low contribution profit per order (CPO), which means your variable costs per order are too high relative to AOV. This can result from high variable costs, low unit pricing or both. Even high-margin products can yield low CPO if AOV is too low. The key is to look at both marketing execution and business economics to diagnose what’s driving ad spend ROI and identify opportunities for improvement.
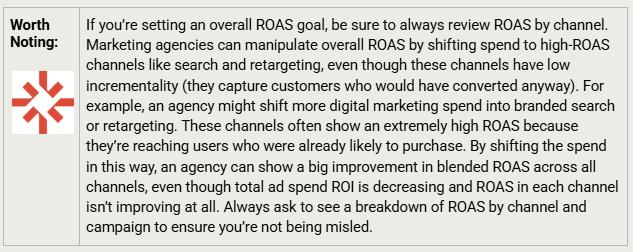
As mentioned earlier, it’s also important to look at total sales versus total ad spend – this is a ‘macro’ view of ROI. Sometimes called the Marketing Efficiency Ratio or MER, this “macro” metric is often where Karlon Group starts – before diving into attribution calculations. Why? Total sales allows you to bypass the inaccuracies that come with estimating attribution and the biases from platform-specific data. When you look at total sales, and more specifically total contribution profit, you’re avoiding the complexities that come with having to attribute orders to different ad channels. You’re also including the organic orders from customers that may have never seen an ad. No doubt, looking at payback this way has its limitations, but I like it because it’s simple to calculate and the data is readily available, even for early stage startups.
Furthermore, it’s a really important starting point for further analysis. If your MER is subpar and not improving, you know right away that you have a problem. It means your growth engine is not working and something needs to change, at least at the aggregate level. It’s no wonder that CFOs and CEOs increasingly rely on MER as a clear, company-wide metric for marketing efficiency.
A final note about ad spend ROI. While the formulas above intentionally exclude fixed costs, you can’t ignore them entirely. While it’s true that your marketing spend should be judged “on the margin” against your contribution costs, the reality is, your business will not make a profit in the form of EBITDA, operating income or net income unless your contribution profit exceeds your ad spend and your fixed costs.If your business has high fixed costs, a high ad spend ROI may not be high enough over the long run. How do your fixed costs impact your businesses overall profitability? How will your fixed costs scale alongside revenue, contribution profit and ad spend? These are important questions to answer that have implications for the viability of your business in the long run.
A simple example: Imagine your contribution margin is 60% and your Ad Spend ROI is 1.0. In other words, you’re at breakeven. For every $100 of ad spend, you generate $167 of sales, which translates into $100 of contribution profit. But what about your other business costs? You likely have overhead costs in the form of salaries, rent, software and equipment. Suppose those fixed costs amount to 20% of sales. If you factor these fixed costs into your breakeven equation, you’d actually need a 2.5 ROAS to breakeven.
Now let’s talk about how to operationalize these calculations in practice. At this point, we’ve introduced the building blocks of ad spend ROI: contribution profit, LTV, and CAC. But it might seem burdensome to have to calculate and track these KPIs constantly to gauge performance. Luckily there’s a way to simplify things. The trick is to turn these KPIs into a ratio that can be calculated quickly with readily available data. The ratio I’m referring to is ROAS, short for Return on Ad Spend. ROAS is the ratio of gross sales to ad spend for a particular period of time. It’s an easier KPI to track because both gross sales and ad spend are easier metrics to observe. You can pull your gross sales directly from Shopify or Stripe. Likewise you can pull ad spend directly from your ad platforms, your ERP, or even your credit card statements and vendor invoices. The trick is to figure out the right ROAS target above which you generate a desired payback.
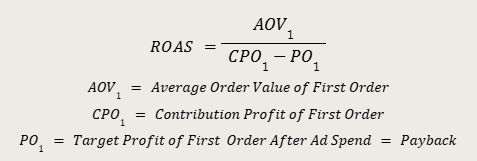
A simple example: Let’s say your AOV is $100, your contribution profit is $50, and you want to target a payback of $20 on the first order. In other words, after your variable costs and ad spend, you want to generate $20 of profit. What should your target ROAS be? The answer is 3.3. At an AOV of $100, a 3.3 ROAS implies ad spend of $30. Your contribution profit of $50 less ad spend of $30 gets you $20 of profit.
Putting this into a formula:
If you want to expand beyond the first order and include LTV in your ROAS, it’s as simple as replacing Contribution Profit with LTV in the formula:
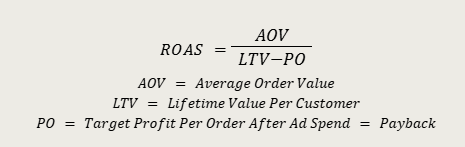
Either way, now you have one simple KPI and one simple goal that can be used to more quickly gauge your ad spend ROI.
There are also software tools that can help you operationalize the calculations and tracking of your ad spend ROI. One example is Pentane, a popular analytics platform. Pentane helps consumer brands connect the dots between revenue, expenses, and marketing performance by centralizing fragmented data from platforms like Shopify, Amazon, QuickBooks, and ad channels. It’s especially valuable for brands looking to understand true LTV, optimize CAC, and make smarter decisions with ROI and cash flow in mind. Pentane’s tools also let you set a target net margin and then work backwards to figure out exactly what ROAS or revenue you need to hit that goal.
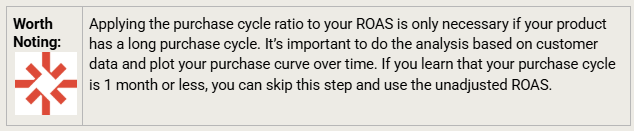
Now let’s talk about the purchase cycle. How do you factor the purchase cycle of a product or service into ROAS? For example, if a customer clicks on an ad today but doesn’t make a purchase until months later, how do you factor this into my ad spend ROI calculations?
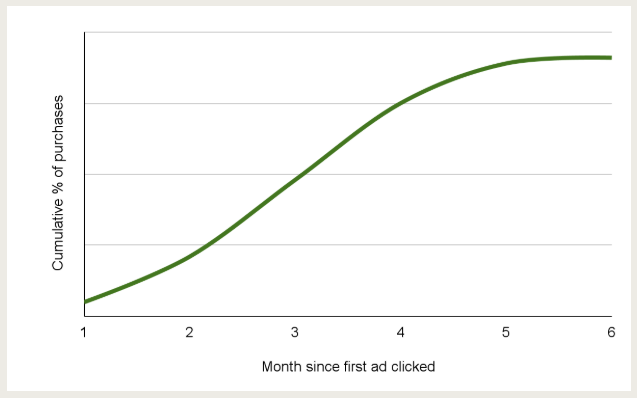
There are three steps to incorporating the purchase cycle into your ad spend ROI. First you have to analyze your customer data and plot your purchase curve over time. The purchase curve shows, for a given cohort3 of customers, what percentage of them made a purchase in the first month, the next month, and so on. The cohorts are typically defined based on when customers first clicked on an ad. You can use off-the-shelf tools like Google Analytics’ time lag report or Facebook Ads conversion windows to help you figure out how long it actually takes for a user to make a purchase. The purchase curve will look something like Exhibit A. You should see the curve flatten out as fewer and fewer customers from the cohort make their first purchase. The month in which the curve is almost flat will indicate the near maximum purchase cycle for your customers in terms of months. I recommend you plot the curve and visually pick your maximum at a point where the curve is close to flat but not totally flat.
The second step is to calculate the ratio of the month 1 percentage to the near maximum percentage. This is called the purchase cycle ratio. If your month 1 percentage is 30% and your maximum percentage in month 6 is 85%, then the ratio is 30% ÷ 85% = 41%.
The final step is to apply this ratio to your target ROAS. Using the example from earlier, if you calculated a target ROAS of 3.3 and your purchase cycle ratio is 41%, then you should targeting a month 1 ROAS of 3. 3 × 41% = 1. 35. The month 1 target ROAS is lower because only a portion of customers who first clicked on the ad have placed their order in the first month
Another operational question you may be asking yourself is, over what time horizon should I track my ROAS? The time horizon will depend a lot on the purchase cycle of your customers. The longer the purchase cycle, the longer the time horizon over which you should look at ROAS. As a startup, you may not fully understand your customer purchase cycle with confidence, so I’d recommend you start by looking at ROAS over one-week, two-week, and one-month time horizons. The sooner you can empirically estimate your customers’ purchase cycle the better, because this can have a material impact on how you calculate ROAS. But when your data analytics toolkit is limited, looking at a range of time horizons will help you triangulate on the truth. You may be tempted to only look at shorter term time horizons, for example last week’s ROAS. But be careful. Shorter time horizons will be more volatile, inaccurate and can lead to short-term swings in ROAS.
In this article, we’ve focused on how to measure and operationalize your ad spend ROI. We’ve taken for granted that the impact of your marketing spend can be measured in clicks, conversions and sales, even if those measurements are imperfect. But there’s a whole other category of marketing that’s even more difficult to track: brand marketing. Brand marketing is a nebulous term but usually refers to marketing campaigns that can’t be easily traced back to individual consumers and don’t prompt an immediate purchase response. Nike’s iconic “Just Do It” campaign or Budweiser’s sponsorships are examples of brand marketing. They’re largely about creating a brand image rather than driving immediate sales. Oftentimes, brand marketing won’t even feature a product. You’ll often see brand marketing as a linear television commercial or a billboard on the sidelines of a major sporting event, although brand marketing can take many forms.
No matter the form or channel, it’s generally harder to attribute sales back to customers who may have seen brand marketing due to inherent limitations in the way the ads are delivered and consumed. For this reason, when companies spend money on brand marketing, they tend to focus on brand awareness impact rather than customer purchases. They may attempt to measure the effects of a brand campaign through an awareness survey, looking for improvements over time to aided and unaided brand awareness.
Since brand marketing is both harder to measure and less likely to drive an immediate purchase, I would generally not recommend it for smaller companies. Big brands like Nike and Anheuser Busch can afford to invest in brand advertising because they have the products, scale and resources to target a broad audience. They also have more sophisticated measurement frameworks, such as Media Mix Modeling, which allows them to tie brand spend to revenue impact. Media Mix Modeling (MMM) is a statistical approach that analyzes sales against different marketing inputs to estimate each channel’s impact. MMM or similar top-down measurement frameworks can provide insight into how brand marketing campaigns, such as linear TV ads or billboards, correlate with sales changes over time. Implementing MMM requires tons of data, expertise and marketing spend (often years of history and millions in spend), so it’s typically only feasible for large companies. Early-stage startups are better off focusing on directly measurable, performance channels until they have the scale and resources to explore brand marketing. We’ll explore Media Mix Modeling in greater depth in a future article in this series.
Key points:
- In the early days, resources are limited and your data is messy. To understand ad spend ROI by channel, you should look at the ad platforms’ proprietary attributed sales numbers and the last click sales numbers, where available. You should also look at total sales vs total ad spend as a way to get a macro view.
- Once you’ve collected your attributed sales by ad platform and your total sales data, the next step is to calculate the contribution profit generated from those sales. Contribution profit looks at sales less the variable costs that a company incurs to service the customer.
- For subscription businesses where the customer typically makes more than one purchase over their lifetime, it usually makes sense to look at the LTV of your customer. For non-subscription businesses where the customer has to opt-in to every purchase, you should ignore LTV and focus on first order contribution if your average customer orders two or fewer times per year. If your customer orders more than two times per year, then it makes sense to look at LTV.
- Once you’ve calculated contribution profit per order or LTV, the next step is to divide it by your CAC to arrive at a ratio. If you’re a subscription business, your Ad Spend ROI Per Customer or LTV/CAC ratio should be above 3 at least. If you’re an e-commerce company, the focus should be first order Ad Spend ROI and you should target a ratio above 1.0 at least.
- Calculating ad spend ROI can be cumbersome, so there’s a shortcut called Return on Ad Spend (ROAS). ROAS is a simple KPI to track because gross sales and ad spend are simple metrics to observe. You just need to use some arithmetic to figure out the ROAS target needed to generate the desired Ad Spend ROI.
- It’s important to adjust ROAS for your purchase cycle by measuring how long it takes your customers to make a purchase after seeing an ad. If your customers have a long purchase cycle, you can apply your purchase cycle ratio to your ROAS to get a month 1 ROAS, so you don’t have to wait months to understand your ad spend ROI.
- Finally, when measuring ROAS, evaluate it across one-week, two-week, and one-month time horizons. In the early days, looking at a range of time horizons will help you triangulate on the truth. You may be tempted to only look at shorter term time horizons, for example last week’s ROAS. But shorter time horizons will be more volatile, inaccurate and can lead to overreactions (positively or negatively) to short-term swings in ROAS.
About the Author:
Karsten Loose is co-founder and Managing Partner at Karlon Group, a fractional finance and accounting firm that helps companies build, scale, and optimize their finance and accounting functions. Karlon Group works with companies across SaaS, e-commerce, manufacturing and technology, offering a full suite of finance and accounting support tailored to each client’s changing needs.