
Blog Series: The ROI-Driven Marketing Playbook
This is the first article in a five-part series about performance marketing ROI, authored by Karlon Group. The series is meant for professionals in the digital consumer space that want to better understand how to measure ad spend ROI.
If you’re a CEO, CFO or CMO in e-commerce or consumer tech, chances are, you spend a significant amount of money on digital marketing. After all, it’s your main driver of growth and the one you have the most control over. But it’s also complicated. You’re not sure if you’re spending the right amount in the right channels. You want to improve your capabilities but you’re not exactly sure where to start and what to prioritize. You recognize it’s a blend of art and science but you’re unsure how to strike the right balance. You may be asking yourself:
- What is the best way to measure digital ad spend ROI given my data analytics stack today?
- What investments should I be making in analytics tools and data infrastructure to improve my measurement capabilities?
- What are the practical limitations I’m up against in measuring ad spend ROI? How scientific can I get?
- How can I overcome these limitations and what does the “end state” of a fully-optimized performance marketing function look like?
Over the next several weeks, I’ll be releasing a series of articles that walk through the 4 phases of performance marketing in e-commerce or consumer tech1. These articles will give you a practical roadmap for how to build and improve upon your performance marketing capabilities no matter the stage of your company. I’ll cover the concepts that are at the foundation of ad spend ROI, the analytics tools and data infrastructure you’ll need to build a world-class performance marketing function, and the inherent limitations of performance marketing. I’ll also incorporate real-world examples of how these capabilities translated into insights and cost savings from our friends at Hawke Media.
We look forward to getting your feedback along the way.
At Karlon Group, we help empower our clients to make “the right decisions at the right time” when it comes to finance. We also like to encourage a healthy dose of humility and caution in any digital marketing efforts.
We’re going to begin our journey by looking at the ideal future state of performance marketing. What does a world-class performance marketing function look like? What KPIs should you measure and how often? What data do you need to collect? What’s the formula for optimal ad spend ROI?
Let’s start with a few important concepts and talk about what that “ideal “end state” should look like for each of them.
ROI: There are many ways to measure ROI, or Return on Investment, in performance marketing. Let’s start by thinking about the concept of ROI and what it really means. In performance marketing, the term ROI refers to the “return” you get, in terms of profit, on the “investment” you made, in terms of ad spend. For a single customer, the “return” is the profit you generate on that customer’s purchase (or purchases) and the “investment” is the money you spent on ads that the customer consumed before making the purchase. That’s the simple definition of ROI in the context of performance marketing. We’ll get into some of the nuances in this article.
Attribution: Attribution is the process of connecting each customer’s purchase back to the marketing channels or campaigns that influenced it. This helps companies understand how their ad spend drives revenue and profit. Attribution is challenging because customer journeys are rarely linear – people often encounter multiple ads across different platforms over days, weeks, or even months before converting.
For example, someone might click a Facebook ad, later Google the brand and click a search ad, and finally make a purchase after receiving an email promotion. Which channel gets the credit? That’s where attribution models come in.
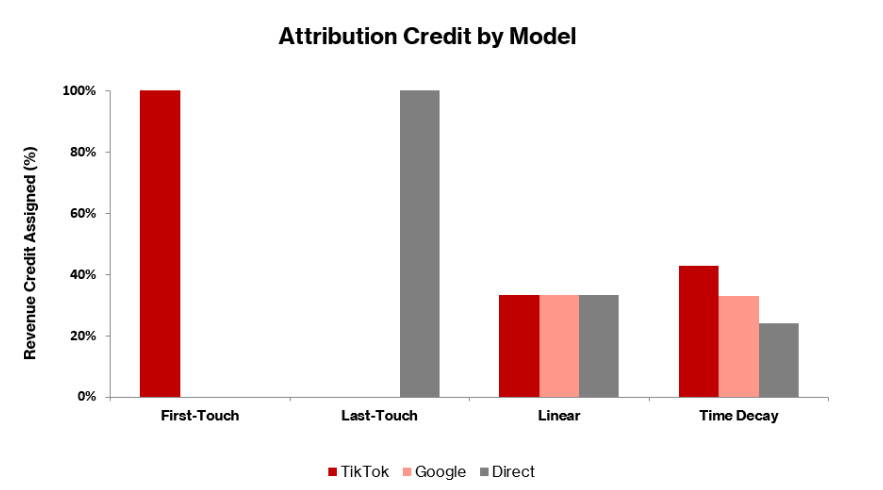
Basic models like first-touch or last-touch give full credit to the first or last channel the customer interacted with. More advanced companies use multi-touch attribution, which distributes credit across multiple touchpoints.
For instance, if a customer saw a TikTok ad, then clicked a Google search ad, and finally purchased after visiting the website directly, a multi-touch model might assign 30% of the credit to TikTok, 50% to Google, and 20% to direct traffic. In practice, this means that if the customer made a $100 purchase, TikTok would be credited with $30 of revenue, Google with $50, and direct traffic with $20. These revenue “credits” help marketers calculate return on ad spend (ROAS) by channel – for example, if $500 was spent on TikTok ads that collectively drove $1,500 in attributed revenue, the ROAS would be 3x. We’ll get more into ROAS later in this series.
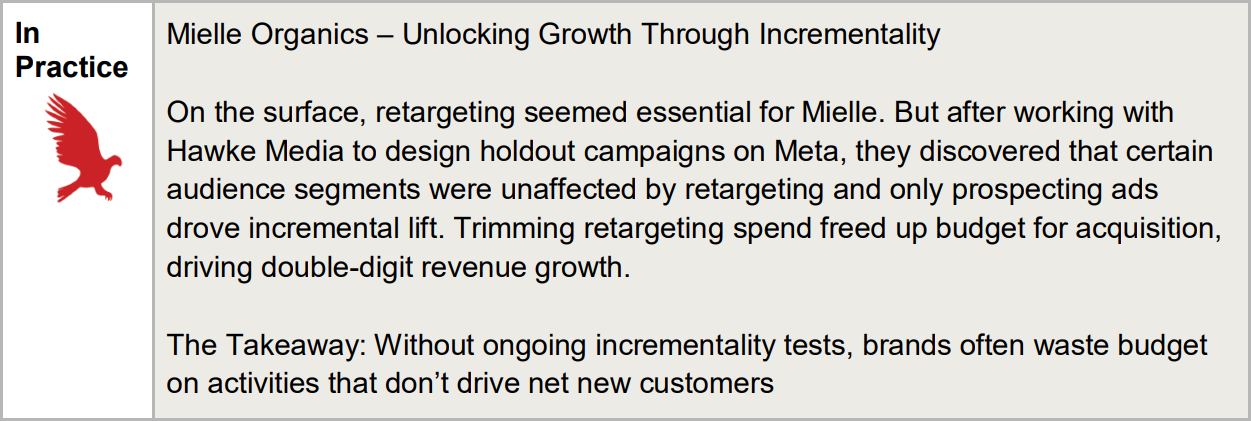
Incrementality: Attribution tells you which ads a customer interacted with. Incrementality asks a deeper question: Did the ad actually influence the purchase? In other words, would the customer have purchased anyway, even if they hadn’t seen the ad? This concept is critical. If your ad spend isn’t driving incremental purchases, that spend isn’t driving profit, which means you’re probably not getting a good ad spend ROI. Incrementality measures the true lift that your ads generate i.e. the additional purchases driven by your ad spend that wouldn’t have happened without it.
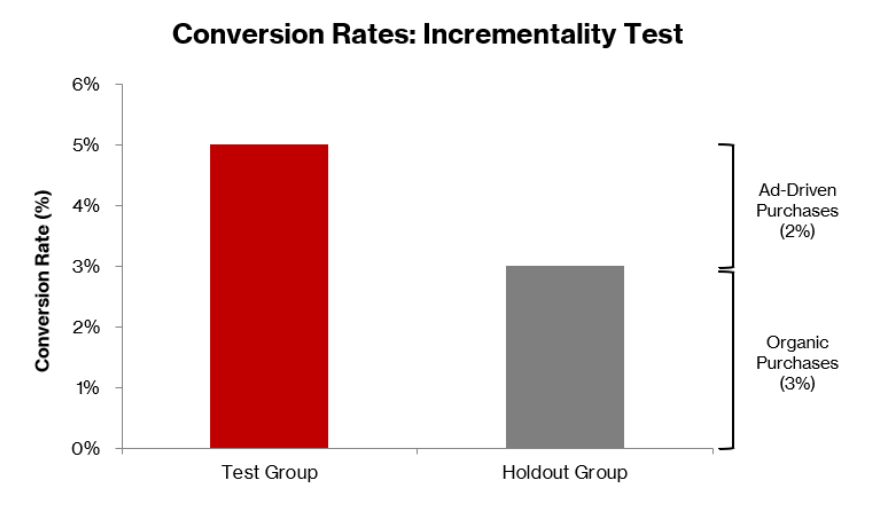
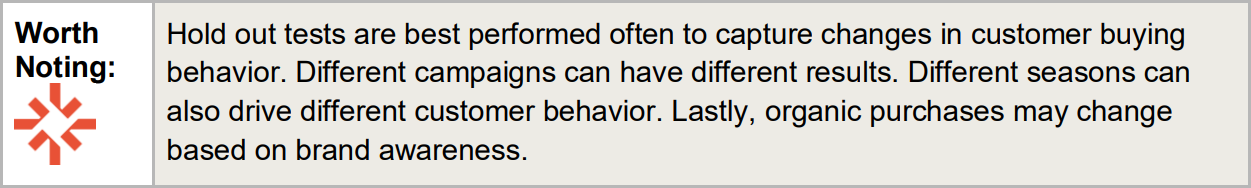
In a perfect world, you’d know exactly which customers were influenced by an ad and which were not. In reality, the only way to get close is by running holdout tests. These experiments split your audience into two groups: one group sees the ad (the test group), and the other doesn’t (the holdout group). You then compare the conversion rates between the two.
Let’s say you run a campaign and find that 5% of the test group made a purchase, while 3% of the holdout group made a purchase without seeing the ad. The incremental lift is 2 percentage points – meaning only 40% of the observed purchases in the test group (2 out of 5) were truly driven by the ad. That means only 40% of the associated revenue should be attributed to your ad spend when calculating ROI. The other 60% would have happened anyway.
These organic purchases – sales that happen without paid marketing – are a crucial part of any business. They can come from word of mouth, strong brand equity, or social proof (e.g., seeing someone else use the product on social media or in real life). Understanding how much of your business is organic versus driven by paid marketing helps you avoid over-investing in channels that aren’t delivering incremental value.
Sophisticated performance marketers pair attribution models with incrementality testing to avoid false signals. Just because a channel touches a lot of conversions doesn’t mean it’s driving them. Incrementality testing helps you separate correlation from causation – and spend more efficiently as a result.
Some ad platforms, like Meta and Google, offer their own incrementality estimates using internal models and experiments, such as Meta’s Conversion Lift tool or Google’s Geo Experiments. These tools use randomized control groups or geographic holdouts to simulate the effect of your ads. While helpful, these platform-provided results are often limited to that platform’s data and may not account for the full customer journey across multiple channels. That’s why many sophisticated marketers run their own incrementality tests or use third-party measurement tools to validate and cross-check platform-reported lift.
Purchase cycle: How long does it take a customer to make a purchase decision? It depends on the product. Some products, like soda and chapstick, have short purchase cycles because they’re cheap, frequently used, and don’t require much research. Other products, like furniture and laptops, have long purchase cycles because they’re expensive, long-lasting, and often involve comparison shopping. There’s a spectrum here and many products – digital and physical – fall somewhere in the middle. Likewise, many products have different purchase cycles depending on the season, with shorter purchase cycles during highly promotional periods like black friday / cyber monday. Understanding your product’s purchase cycle is essential for attribution. In a perfect world, you’d know exactly how long each customer takes to make a decision – and could map every ad they saw from first touch to final purchase. That way, you’d better understand how long your marketing efforts take to convert, and how to allocate spend accordingly.
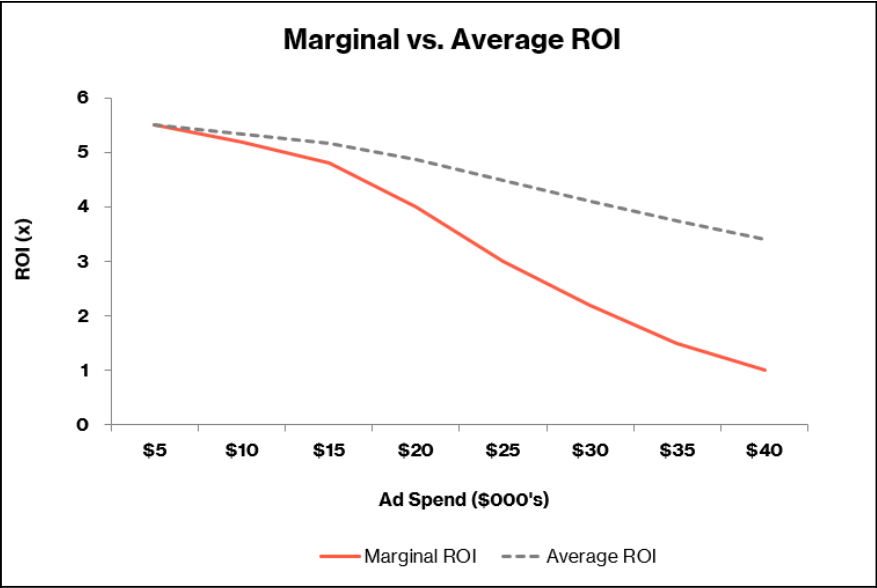
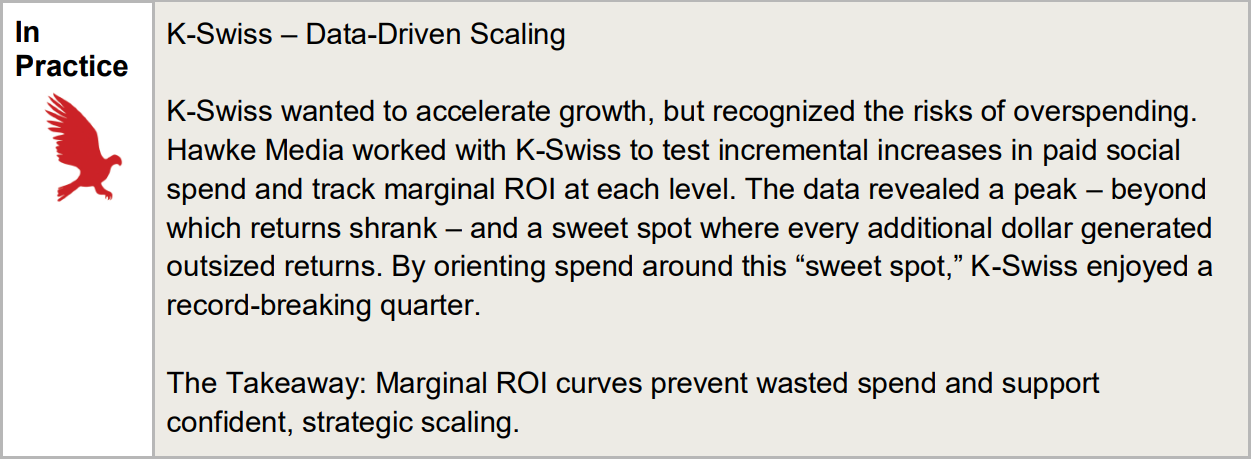
Marginal ROI: It’s one thing to know the ROI of a campaign after you’ve run it – but what if you want to spend more (or less) ad dollars next month? Will your return improve, stay flat, or decline?
This is where understanding marginal ROI is important. Marginal ROI looks at the return on the next dollar spent, not just the average return on all dollars spent. Without insight into marginal ROI, you’re flying blind when it comes to scaling your budget. A campaign that looks profitable at $10,000 in spend may become less efficient at $50,000 – or vice versa.
In a perfect world, you’d know your ROI curve for each channel, showing how your marginal profit changes as you increase or decrease ad spend. This would help you allocate budget more intelligently, pulling back on channels with diminishing returns and doubling down on those with untapped potential.
Contribution Profit: To calculate return on ad spend (ROAS), it’s not enough to compare sales to ad spend. You need to understand the profit generated from each purchase, factoring in all the variable costs that your company incurs to service the customer. Depending on whether you’re a consumer tech or an e-commerce business, these costs may include:
Consumer Tech: Compute costs, hosting costs, customer onboarding costs, product shipping costs, promotional discounts, refunds, merchant/app fees, customer support costs
E-Commerce: Physical product costs, hosting and e-commerce platform fees, product shipping costs, promotional discounts, refunds/returns, return logistics costs, merchant/app fees, customer support costs
In a perfect world, you’d know these costs at the customer level, since not every customer purchases the same product, receives the same discount, or is shipped product to the same location. You’d also know this at the purchase level, for each purchase a customer makes over time.
Lifetime Value (LTV): This brings us to the concept of lifetime value, or LTV2. LTV is the total contribution profit of a customer over the average lifetime of a customer. For subscription businesses, a customer will usually make more than one purchase over their lifetime. Some subscriptions offer a service at a flat monthly subscription fee, while others include a flat subscription fee and additional service charges. Either way, for subscription business, a customer typically signs up at the time of their initial purchase and then automatically receives the product until they cancel. Some subscription products come with a committed term, for example a one-year subscription, and customers can only choose to cancel the subscription at the end of the term. For subscriptions, to calculate the lifetime value, you should look at the average lifetime of a customer, factoring in the rate at which customers cancel or “churn” on average.
Many e-commerce businesses are not subscription-based and the customer must opt-in to each order. While churn isn’t as clearly defined, you can still calculate LTV by analyzing average order frequency and repeat rates. It just takes a little extra work, as these metrics vary widely depending on the product category – think of the difference between a daily-use coffee brand and a luxury mattress.
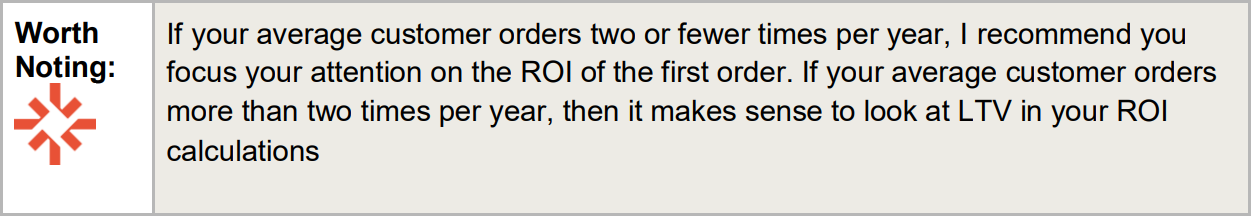
One final point to emphasize: Regardless of whether you’re running a subscription business or not, it’s critical to understand the unit economics of a customer’s first order. Specifically, whether the contribution profit from that initial purchase is enough to cover the ad spend needed to acquire a customer.
If the contribution profit from the first order exceeds the ad spend to acquire the customer, your business is adding customers profitably from day one. This improves cash flow and reduces the amount of external capital required to grow. Each new customer generates surplus cash that can be reinvested into future growth, allowing you to scale in a more capital-efficient way.
But if you’re losing money on the first order, then growth burns cash. The faster you acquire customers, the more capital you need to fund that growth. Unless your AOV or contribution margin improves over time or your ad spend needed to acquire a customer decreases, the model may not be sustainable. This is why experienced investors pay close attention to first-order profitability – it’s a key signal of whether the business can scale without constant infusions of outside capital. At Karlon Group, we routinely advise clients on how to adjust their marketing spend to solve for first-order profitability. This is especially critical for e-commerce companies.
This leads to an important concept that we’ll explore in the next article: breakeven ROI – the point at which a customer’s cumulative contribution profit equals the cost to acquire them. For some businesses, this breakeven happens on the first order. For others, it may take two, three, or more repeat purchases. In the next article, we’ll dig deeper into how to calculate breakeven ROI and why understanding customer payback periods is essential to planning your marketing strategy and managing cash flow as you scale.
Real Time Analytics: How often should you be calculating ROI? In a perfect world, you’d have real-time analytics flowing into your dashboards, giving you an up-to-the-minute view of how ad dollars are performing. The faster your feedback loop, the faster you can respond to cut underperforming campaigns, reallocate spend, or double down on what’s working.
In practice, there are limits to how useful real-time data is. For many products – especially those with longer purchase cycles – customers may take weeks or even months to convert. That means performance data collected in the first few hours or days may not reflect the true impact of a campaign. Multi-touch attribution models also take time to gather enough data across channels to fairly assign credit to each channel.
Because of these constraints, most companies adopt a tiered approach. They track top-of-funnel signals like impressions, spend, traffic, and early conversion proxies (e.g., add-to-cart events) in real time to spot trends or detect issues quickly. But they wait for more complete data before drawing conclusions about conversion and ad spend ROI. Evaluating return on ad spend weekly and monthly strikes a good balance between speed and reliability.
The key is knowing the difference between directional signals and statistically valid insights. Real-time data helps you stay responsive, but deeper ROI analysis over longer intervals gives you the confidence to make meaningful strategic decisions.
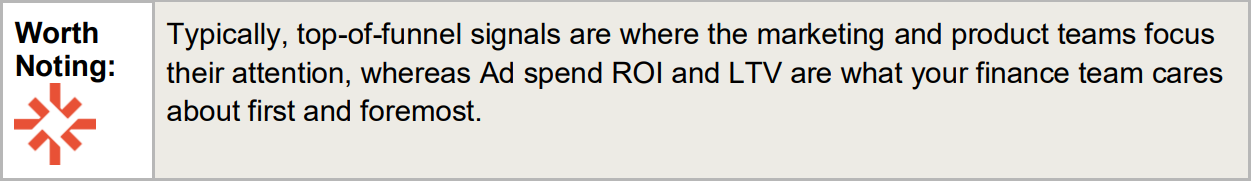
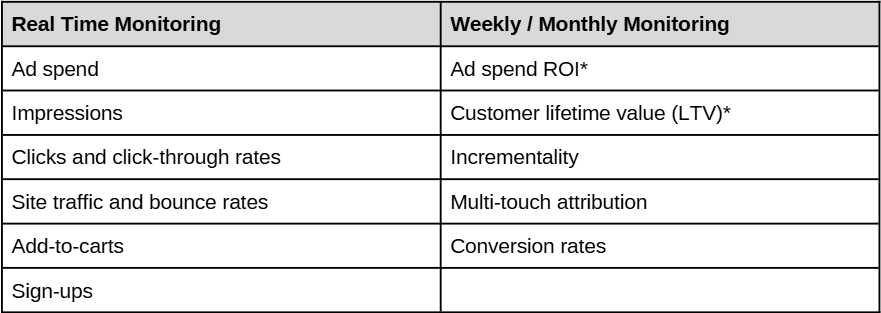
*What your finance team cares about first and foremost. Karlon group recommends emphasizing these metrics in monthly KPI reviews.
Now that we’ve outlined the “ideal state” of performance marketing, the obvious question is:
What should I do in the real world, given my data analytics stack today? And, what investments should I be making in marketing tools and data infrastructure to improve my measurement capabilities for tomorrow?
That’s exactly what we’ll explore in the rest of this series. We’ll walk through how marketing measurement evolves – from the early startup phase to a more mature, data-rich organization. You’ll learn what metrics to track, what tools to use, and how to think about ROI at each stage of growth.
Key Points:
- In performance marketing, the term ROI refers to the “return” you get, in terms of profit, on the “investment” you made, in terms of ad spend.
- We use an “end state” hypothetical to illustrate the complexities of measuring ROI. In this end state:
- You can attribute your ad spend by channel to each customer purchase and measure each customers’ contribution profit.
- You know how your ROI changes when you spend more or less on a particular campaign or channel.
- You know exactly what each customer’s purchase cycle is and are able to attribute the ads that a customer saw along their purchase journey from start to finish.
- You’re able to make all these calculations across all your marketing channels in real-time so you can constantly adjust your ad spend mix in response.
- In reality, calculating ad spend ROI is nuanced and challenging. Not all customers who make a purchase saw an ad or – for that matter – were influenced by an ad they saw. Furthermore, depending on the product and the customer, the purchase cycle and the number of ads viewed can vary a lot.
In the next article, we’ll explore what performance marketing looks like in the early days of an e-commerce or consumer tech startup. What’s the typical software stack? What metrics can you realistically track? And how should you evaluate marketing ROI when your team and resources are limited?
About the Author:
Karsten Loose is co-founder and Managing Partner at Karlon Group, a fractional finance and accounting firm that helps companies build, scale, and optimize their finance and accounting functions. Karlon Group works with companies across SaaS, e-commerce, manufacturing and technology, offering a full suite of finance and accounting support tailored to each client’s changing needs.